
| Managing a Customer Contact Center | ||
| Instructor: Brad Cleveland | ||
| Released: 10/6/2022 | Course Details 1h26m Intermediate | |
| Skills Covered Contact Centers | Course Link | |
| Professional Certifications and Continuing Education Units (CEUs) N/A | ||
| Customer contact centers face a number of new developments: more channels, higher levels of complexity, and greater strategic value. In this course, customer strategy and management expert Brad Cleveland shows you how to leverage these developments to set up your organization for maximum success. He outlines the components of a customer access strategy and the forces that make contact centers unique: random workload arrival, the visible or invisible queue, and the seven factors of customer tolerance. He also helps you plan your resources effectively so you can develop accurate forecasts. Last, he demonstrates how to maximize the quality and value of your contact center and use existing quality metrics to improve center performance. Learning objectives – Recognizing key contact center trends – Realizing the value created by contact centers – Developing a customer access strategy – Identifying performance gaps – Choosing service level and response time objectives – Forecasting your workload – Establishing a long-term staffing plan – Forming measurable objectives – Monitoring and coaching individuals – Skills covered Source: LinkedIN Learning | ||
Navigating the Dynamic Contact Center Environment
Trends shaping today’s contact centers
- Growing numbers of contact channels
- Increased strategic importance
- Customers expect more
- Customer expectations
- Be accessible
- Treat me courteously
- Be responsive to what I need
- Provide well trained employees
- Customer expectations
Maximize impact and value
- Level 1 – Efficiency
- Level 2 – Customer Satisfaction and Loyalty
- Level 3 – Strategic Value
Customer access strategy
Customer Access Strategy
A framework defining the means by which customers and organizations can interact or be enabled to access information, services, and expertise needed.
10 Components
- Customer segments
- Types of interactions
- Access channels
- Hours of operation
- Service level and response time
- Routing methodology
- People and technology resources
- Information required
- Analysis and improvement
- Guidelines for deploying new services
Three driving forces in contact centers
Three Driving Forces
- Random workload arrival
- Contacts arrive as they choose and randomly. Workload not predictive.
- The queue
- Is it visible or invisible to our customers?
- Some contact center systems provide wait time estimates to callers. This is called a visible queue where a customer may begin to be disgruntled but gets happier as they get closer to being answered by an agent.
- Invisible queues have the opposite effect, a caller starts happy but grows frustrated the longer they wait, not knowing how long the wait will last and growing impatient.
- Seven factors affecting customer tolerance
- Degree of motivation
- Availability of substitutes
- Competion’s service level
- Level of expectations
- Time available
- Who’s paying for the call
- Human behavior
Definition of contact center management
Contact Center Management
“The art of having the right number of properly skilled people and supporting resources in place at the right times to handle an accurately forecasted workload at service level and with quality.” — Source ICMI
Effective Resource Planning
Introduction to contact center planning
“82% of consumers say the number one factor in a great customer service experience is having their issues resolved quickly.” — Source: ICMI
9 Steps of Planning:
- Choose Service Level and Response Time Objectives
- Collect Data
- Forecast Workload
- Calculate Base Staff
- Calculate System Resources
- Calculate Shrinkage
- Organize Schedules
- Calculate Cost
- Repeat for Higher and Lower Levels of Service
Accessibility: Service level and response time
In this step you tie the resources your need to the results you want to achieve.
Customer Related Work
- Immediate – Service Level: Phone calls, video, chat, text, walk in customer
- X% answered in Y seconds
- Random – difficult to plan
- Deferred – Service Level: Email, postal mail, interactions through social channels
- 100% handled within N hours/days
- Easier to plan based on # of resources and how many items they can process per hour or day.
| General Comparisons | Service Levels (X% answer/Y seconds) |
|---|---|
| Emergency services | 100/0 |
| Service level objections “high” | 90/20, 85/15, 90/15 |
| Service level objections “moderate” | 80/20, 80/30, 90/60 |
| Service level objections “modest” | 70/60, 80/120, 80/300 |
| Common | High end of range | |
|---|---|---|
| Customer email | Within 24 hours | Within 1 to 4 hours |
| Customer voicemail | Within 24 hours | Within 1 to 4 hours |
| Social-deferred | Within 24 hours | Withing 1 to 4 hours |
| Postal mail | Within one week | Within 1 to 2 business days |
Forecast the workload
This involves steps 2 and steps 3 in the planning process; collect data and forecast workload.
Three Components of Workload:
- Talk Time – time your spend with the customer during the interaction including hold time.
- After-Call Work – any additional time associated with the interaction that occurs immediately following talk time.
- Volume – how many customer contacts are there to handle?
Reports helpful for forecasting:
- Calls by Day of the Week – can demonstrate daily volume and also identify holidays
- Half Hourly Calls Offered or Hourly Calls Received – can demonstrate spikes
- Average Handle Time – helpful to see time requirements.
Forecasting Tips
- Forecast at the agent group level.
- Track accuracy of forecast.
- Make adjustments.
Calculate base staff
This involves steps 4 and steps 5 in the planning process; calculate base staff and calculate system resources. The industry standard is Erlang C however it has its faults, as it relies on every interaction being answered and can overestimate because it does not factor abandoned calls. Also, the formula is complex but most software will require four inputs to make calculations.

Inputs:
- Average talk time in seconds = 180
- Average after-call work (wrap up) in seconds = 30
- Calls per half hour = 250
- Service level objective in seconds = 20
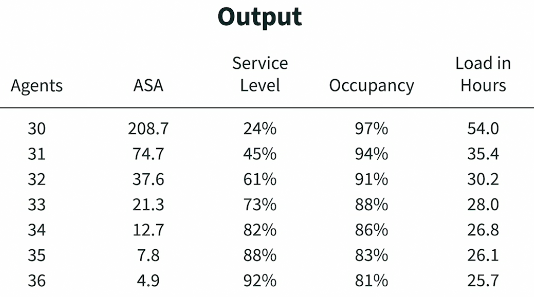
Example – 34 agents will have an ASA of 12.7, meaning the next call would be answered in 12.7 seconds. Occupancy will be 86%, some agents will still be available. Load in Hours is designed for your telecom and IT team to provide data on the network load.
Erlang C assumes all agents in the group can handle all contacts however your call center may be designed by groups which could be organized by level of expertise, spoken language or areas being covered.
Response Time Calculations:
Because these are based on deferred actions that are at not immediate, the formula will focus more on the amount of outputs per hour per agent. Here are the inputs required:
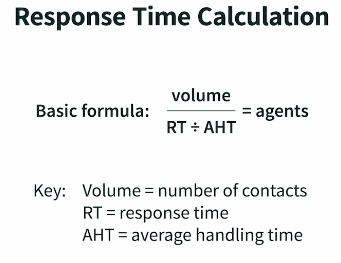
Example – If you have 200 emails that need to be replied in 2 hours (or 120 minutes) and they each have a handling time of 4 minutes, you know you will need a minimum of 7 agents.
The immutable laws
Immutable law means something that cannot be changed. One example is: when the service level goes up, agent occupancy goes down. If you want to provide higher service levels to your customers, you need more agents. Each agent will be less productive in the sense that they’ll be spending more of their time waiting for calls to arrive. Because of this immutable law, performance standards based on the number of contacts handled or occupancy will be counterproductive.
The Law of Diminishing Returns
With poor service levels even modest changes, the staffing, has a big impact and there’s a principle that called the “power of one” that every agent needs to understand. Each person, makes a huge difference.
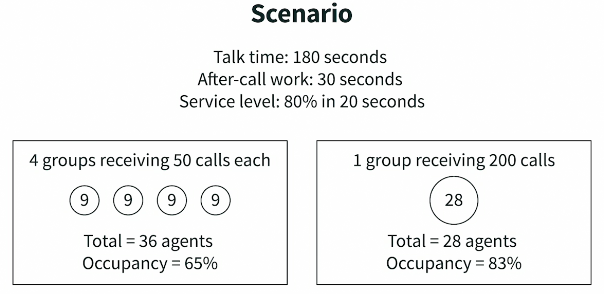
Pooling Principle
If four groups of 9 agents received 50 calls each, the occupancy rate would be 65%. These groups were set up because only certain agents can accomplish a certain task. However, if we cross-trained the group so everyone can learn those tasks, only 28 agents would be required (rather than 36) and the occupancy rate would increase to 83%. Not every agent can be pooled into 1 group, there are limits to the agents ability to learn and retain.
Moving towards the Pooling Principle
- Hire multilingual agents
- Integrate new channels into existing agent groups
- Improve systems
- Train broad skills
Effective scheduling
This involves step 6 and step 7 of the planning process; calculate shrinkage and organize schedules.
Explore scheduling alternatives starting with offering conventional shifts (core group of agents working 9am to 5pm, for example) and then stagger shifts (for later times when volume increases), adjust breaks, lunch, or meeting schedules. Hire part-timers, use hiring to your advantage to ensure employees work the time required and use an envelope strategy.
Three Secrets For Good Scheduling Results:
- Collaborate with agents to build schedules
- Model different scenarios
- Clarify the organization’s values
Long-term staffing plan
This involves step 8 and step 9 of the planning process; calculate cost and repeat for higher and lower levels of service.
Workload:
Projected volume of contacts x Average handling time
Presence: Is the agent working today?
Utilization: schedule to handle customer contacts?
Random Factors: Is the agent actually handling contacts?
Real-time management
Effective Real-Time Management:
- Maintain a strong foundation of quality.
- Monitor real-time develoents.
- Implement a workable escalation plan.
Monitor Real-Time Data:
- Number of contacts in queue
- Longest current wait
- Service level of average speed of answer
- Agent status
Real-Time Tiers of Response:
- Tier 1: routine common sense adjustments
- Tier 2: more involved alternatives
- Tier 3: most involved alternatives
Maximize Contact Center Quality and Performance
Principles of contact center quality
Quality must be defined around customer expectations. High-quality service is cost effective. Quality and service level work together.
Components of a Quality Contact
- Agent provides correct information
- Data entry is correct
- No transfers
- Customer has confidence
- Capture of useful and needed information
The contact center process
Process:
A system of causes
There is little use exhorting agents to improve quality without making improvements to the process.
Key Questions
- What is causing repeat contacts?
- What are customers complaining about?
- Where are you making mistakes?
- What levels do you want to raise or lower?
- What are the innovations opportunities?
Quality tools and methodologies
- Flowchart – track the flow of customer service
- Cause and Effect Diagram (Fishbone) – illustrate relationship between cause and effect
- Scatter Diagram – look at relationship between two variables
- Control Charts – provide information on variation
Measure and objectives for the contact center
- Forecast accuracy
- Schedule adherance
- Service level and response time
- Quality and first contact resolution
- Employee satisfaction
- Customer satisfaction
- Strategic value
Measures and objectives for agents
What Agents Can’t Control:
- Contact arrival rate
- Contact types
- Customer communication
- Accuracy of forecasts and schedules
Measuring Individual Performance:
- Schedule adherence
- Quality
Adherence to Schedule:
How much time during an agent’s shift he or she is handling, or is available to handle contacts.
90% Adherence = .90 x 60 minutes = 54 minutes per scheduled hour.
Monitor and coach
Effective Monitoring:
- Document specific, observable behaviors
- Foundation Standards
- Measure whether something was done
- Assessed with a simple yes or no
- Finesse Standards
- Measure how something was done
- Allow for style and individuality
- Provide room for interpretation
- Scoring Approaches
- Yes/No
- Numerical range such as 1 to 3, 1 to 5
- Foundation Standards
Coaching:
The Best Coaches:
- Build trust, respect and accountability
- Clarify goals
- Serve as role models
- Provide positive reinforcement
Key technology developments
- Hosted and Cloud based alternatives
- Routing
- Workforce optimization
- Quality monitoring
- Customer Relationship Tools
- Agent desktop
- Accessing and sending documents
- Internal collaboration tools
- Automated greeting
Other Developments:
- Gamification tools
- Knowledge management
- Speech and data analytics
- Advanced self-service capabilities
Enable a supporting culture
- Employees and customers respond to a clear, compelling mission.
- It’s what you do more than what you say that really matters.
- Communication cultivates trust.
- Expect the best.
- Good contact center management is essential.
 | Remember! To experience the full benefit of this guide, I highly recommend you watch the full training session. |